This post will be something different than the previous, because in this post we will learn something about JMeter basics.
We will focus on the topics below:
- What is JMeter?
- What can we do with JMeter?
- How are the JMeter features?
- How to use JMeter?
- JMeter Installation
- JMeter panel
- Example and components explanation
What is JMeter?
Apache JMeter is an Apache project that we can use as a load testing tool for analyzing and measuring the performance of a variety of services, with a focus on web applications.
What can we do with JMeter?
We can perform the load testing and performance testing both on static and dynamic resources. Moreover, we can simulate the heavy load on a server, group of servers, and network or object to test its strength. We may also analyze overall performance under different load types.
What are the JMeter features?
JMeter has a lot of features. We will tell ourselves about some of them now.
As we told before, we are able to load and performance test many different applications, server or protocol types. There are some of them:
- Web – HTTP, HTTPS (Java, NodeJS, PHP, ASP.NET, …)
- SOAP / REST Webservices
- FTP
- Database via JDBC
- LDAP
- Message-oriented middleware (MOM) via JMS
- Mail – SMTP(S), POP3(S) and IMAP(S)
- Native commands or shell scripts
- TCP
- Java Objects
JMeter has its own full-featured Test IDE that allows fast Test Plan recording (from Browsers or native applications), building, and debugging. It has also CLI mode (Command-line mode (previously called Non GUI) / headless mode) to load test from any Java compatible OS (Linux, Windows, Mac OSX, …). JMeter gives us the possibility to present the dynamic HTML reports and it’s complete portability and 100% of Java purity.
How to use JMeter?
Now we know what is JMeter, what can we do with it, and its main features, but we didn’t tell ourselves yet how to use that. Let’s start with an introduction to using JMeter. It will be a basic tutorial where you will get the basic knowledge about using JMeter and perform basic tests.
My environment in this tutorial:
System: macOS
Java version: java version “15.0.1” 2020-10-20
Java(TM) SE Runtime Environment (build 15.0.1+9-18)
Java HotSpot(TM) 64-Bit Server VM (build 15.0.1+9-18, mixed mode, sharing)
JMeter Installation
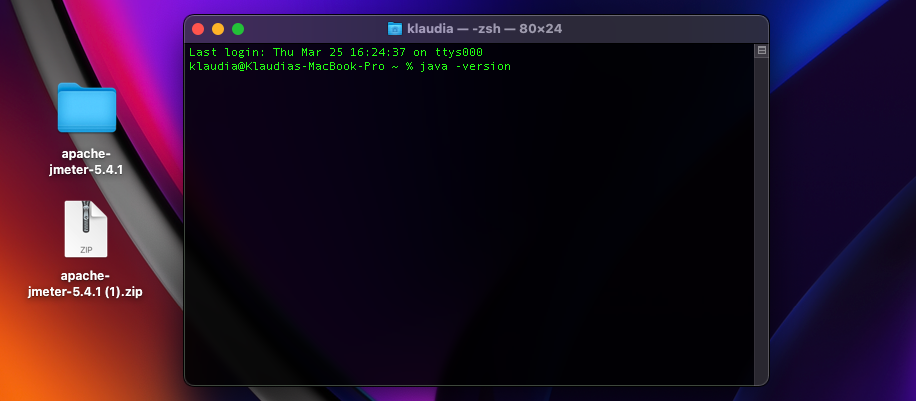
First of all, we need to check the java version on our machine.
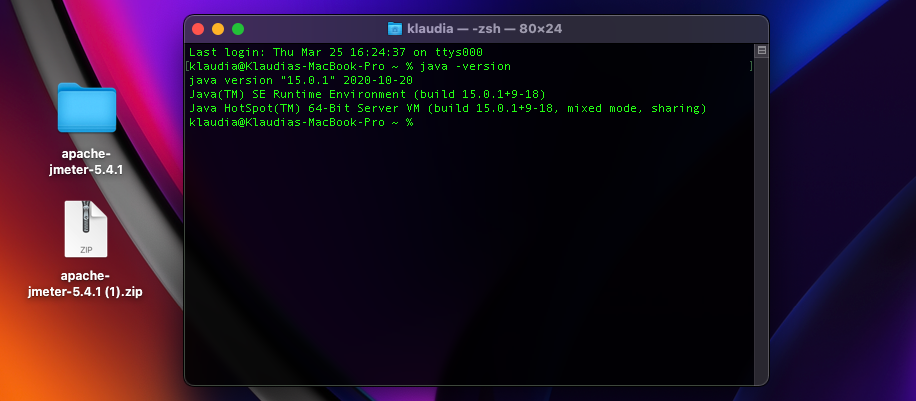
If you don’t have java don’t worry, you can download it and install here.
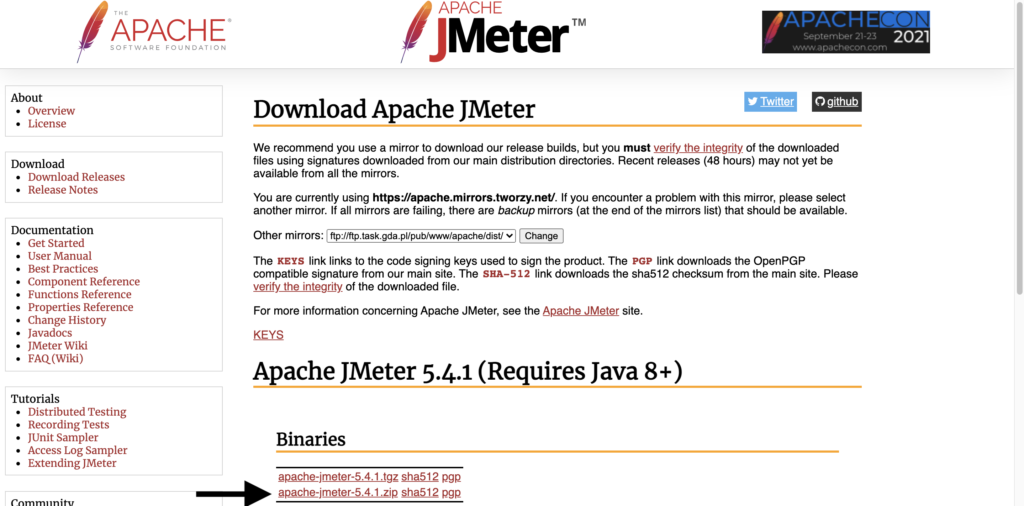
First of all, we need to install JMeter Package. To do that, we need to enter the URL: https://jmeter.apache.org/download_jmeter.cgi and download the apache-jmeter-5.4.1.zip.

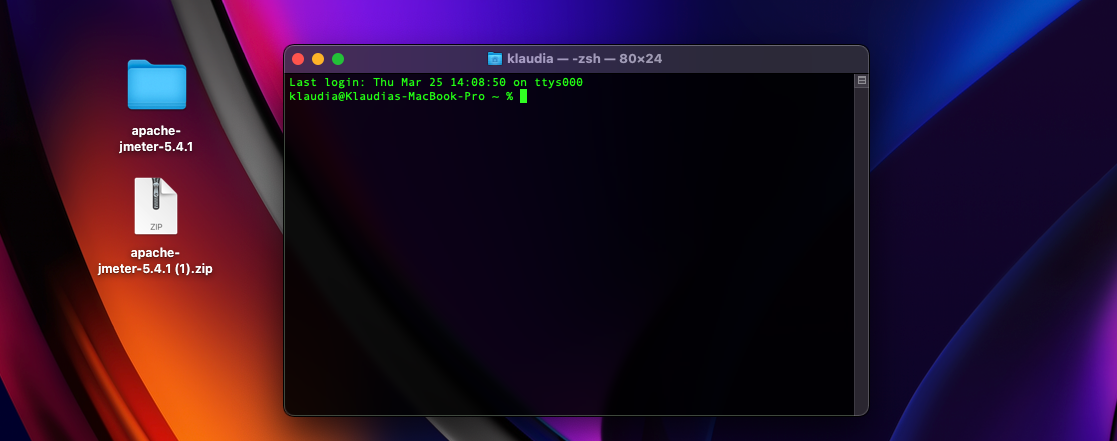
Once we’ve expanded the folder from zip folder, we can open terminal (MacOS/Linux) or Command Prompt (Windows).

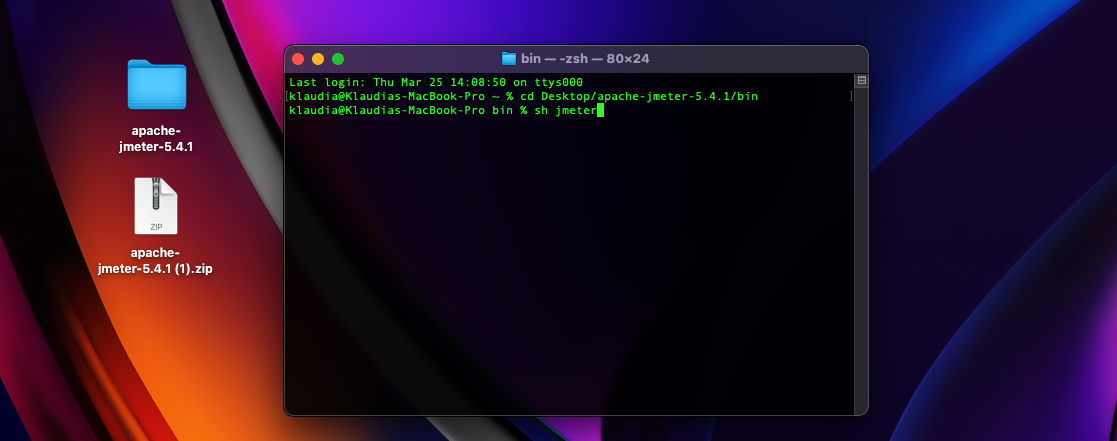
Once we’ve opened the terminal, we can type: cd Desktop/apache-jmeter-5.4.1/bin and open JMeter by command: sh jmeter.
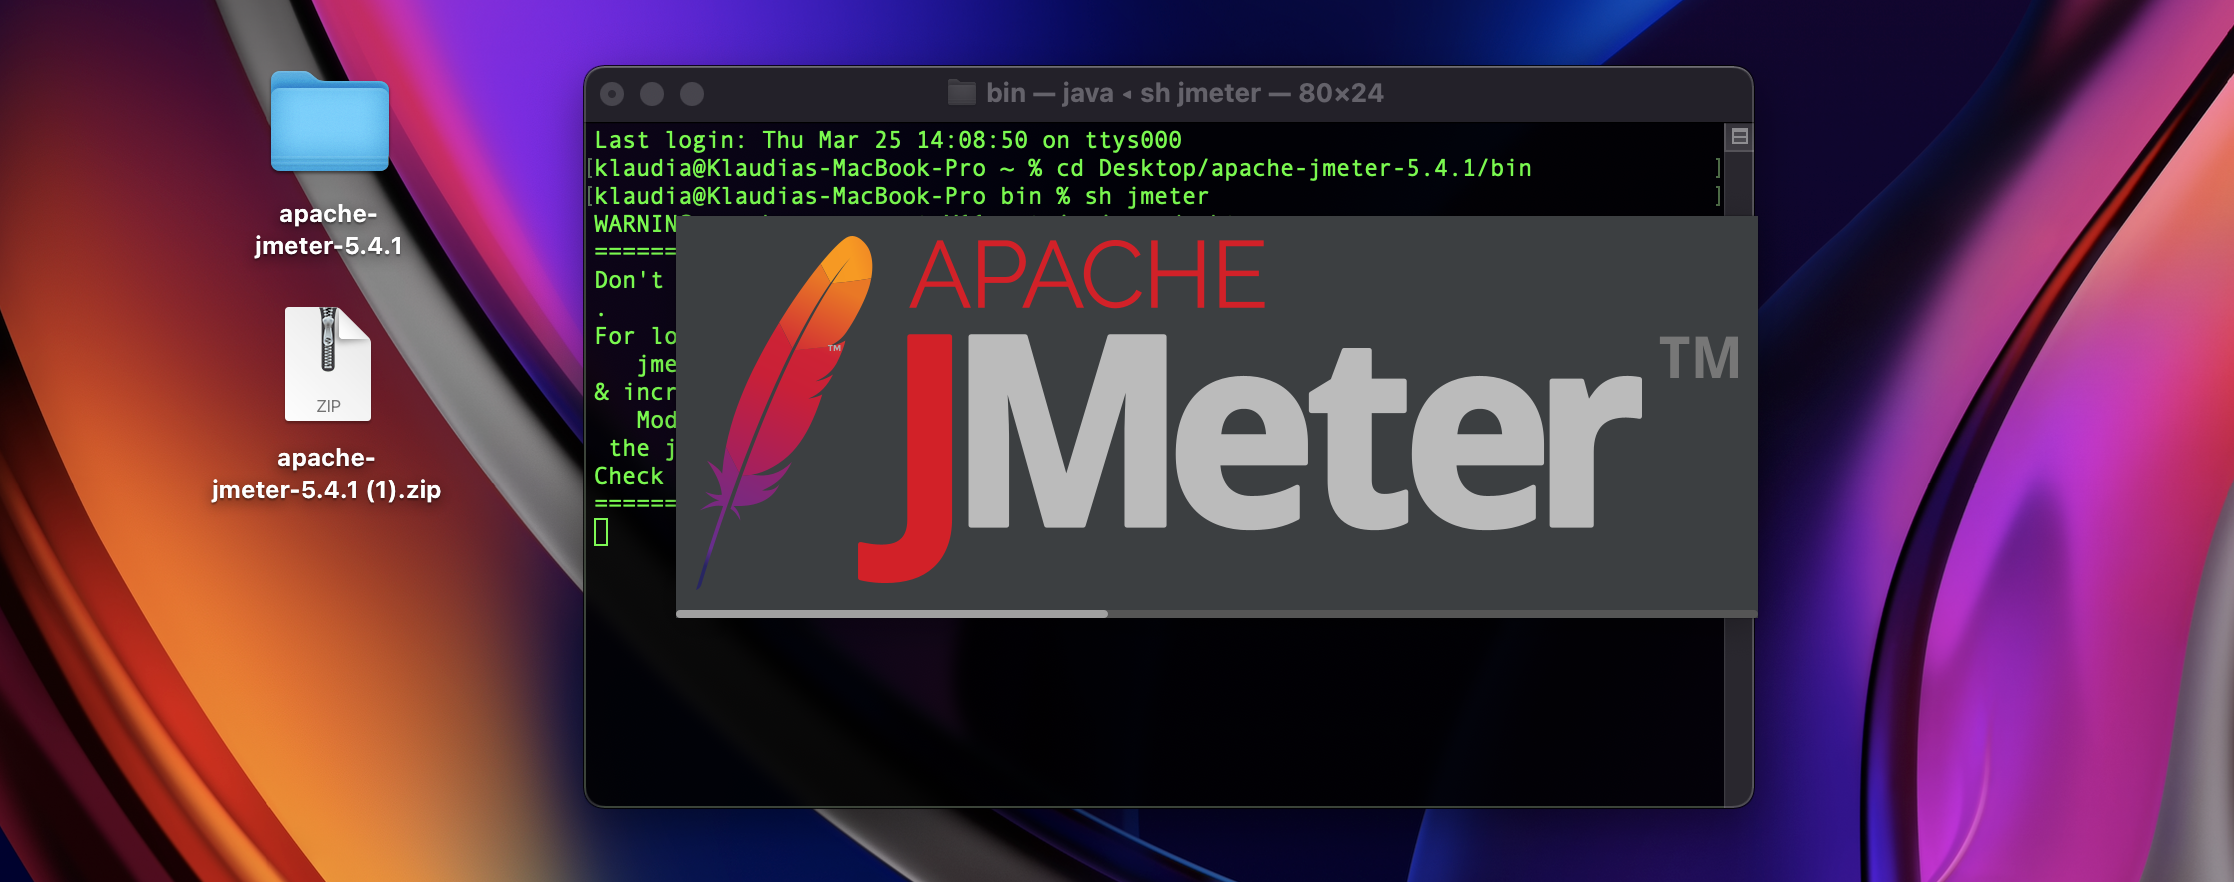
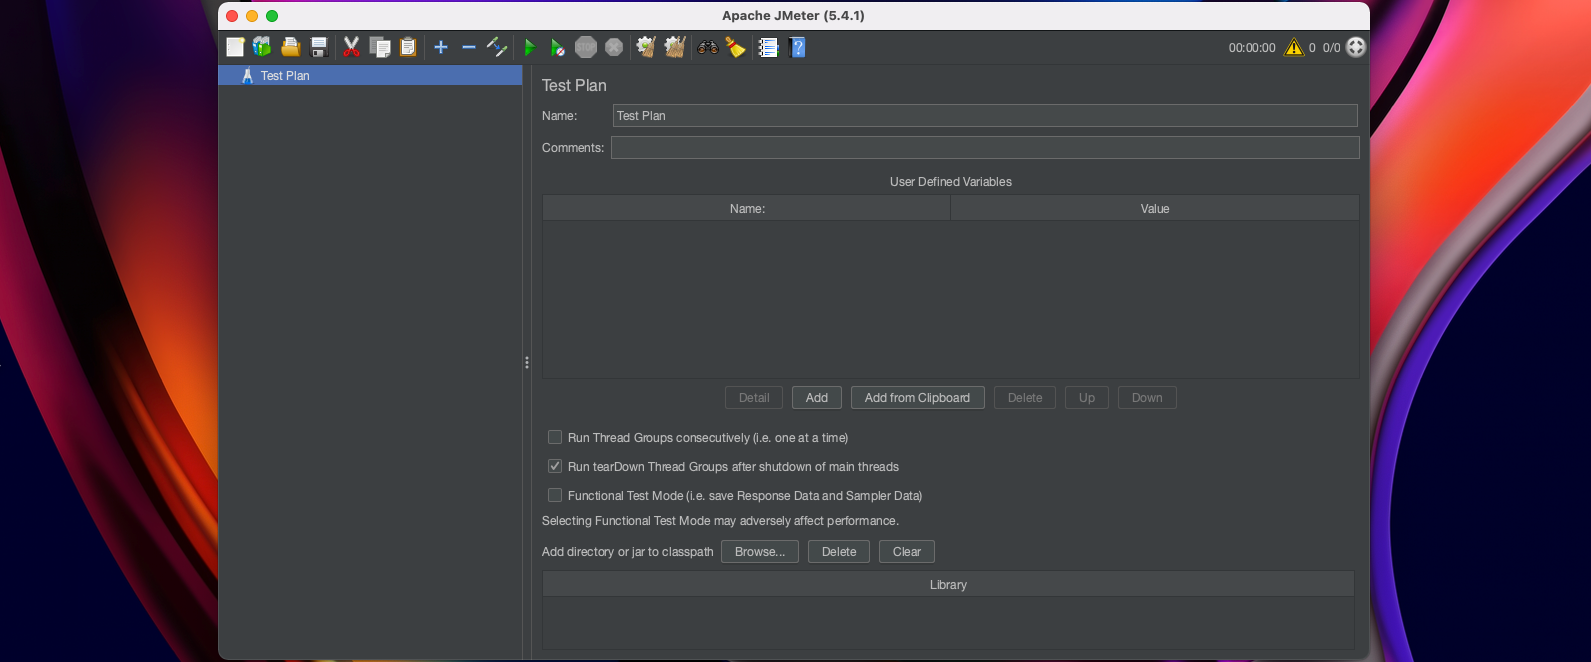
Great! We’ve opened JMeter successfully 🙂
Now we can focus on components of JMeter.
First thing what we will explain it’s the JMeter panel.
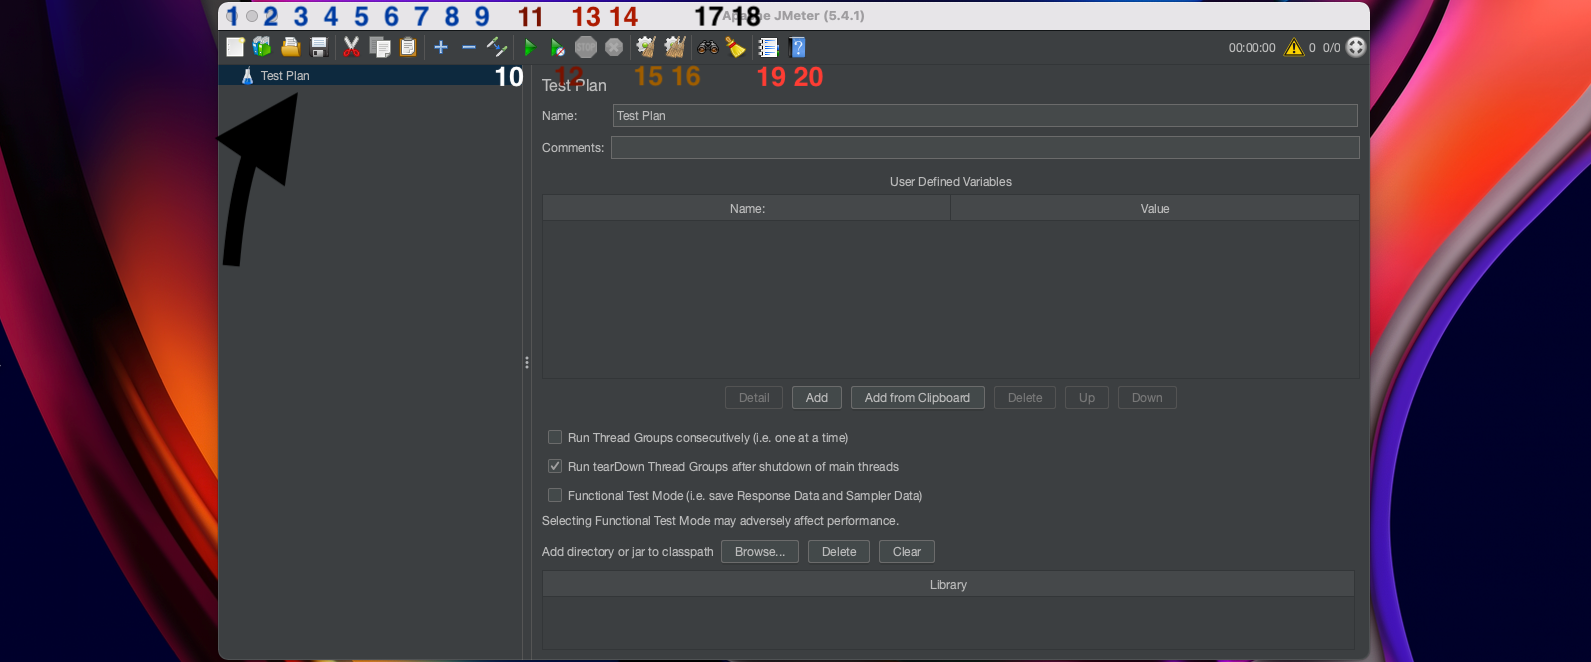
- New
- Templates
- Open
- Save
- Cut
- Copy
- Paste
- Expand all – showing all files in Test Plan if are hidden
- Collapse all – hiding the files in Test Plan if are showed
- Toggle – switching the file from enabled to disabled and mutually
- Start – running the JMeter script
- Start no pauses – running the JMeter script without pauses
- Stop – stopping the one thread group
- Shutdown – shutting down all threads
- Clear
- Clear all
- Search
- Reset Search
- Function Helper Dialog
- Help
How to make the first Test Case and test it?
We will make the example to better understanding the value of JMeter. To this, we will use the page https://testingtraveler.com/.
Let’s say, we need to ensure that the 200 users can use the contact form and send the message via the contact page within 3 minutes.
The specification is below:
| Method | POST |
| Protocol | HTTPS |
| Host | testingtraveler.com |
| Path | contact |
| Parameter | Value |
| your-name | unique value |
| your-email | unique value |
| your-subject | unique value |
| your-message | unique value |
During doing the example we will explain ourselves the components of JMeter and see how it works in the example.
We will start from add the Thread Group.
The Thread Group is the beginning point of any Test Plan. It’s also referred to as a collection of threads, where each of them represents one user using up the application under Test.
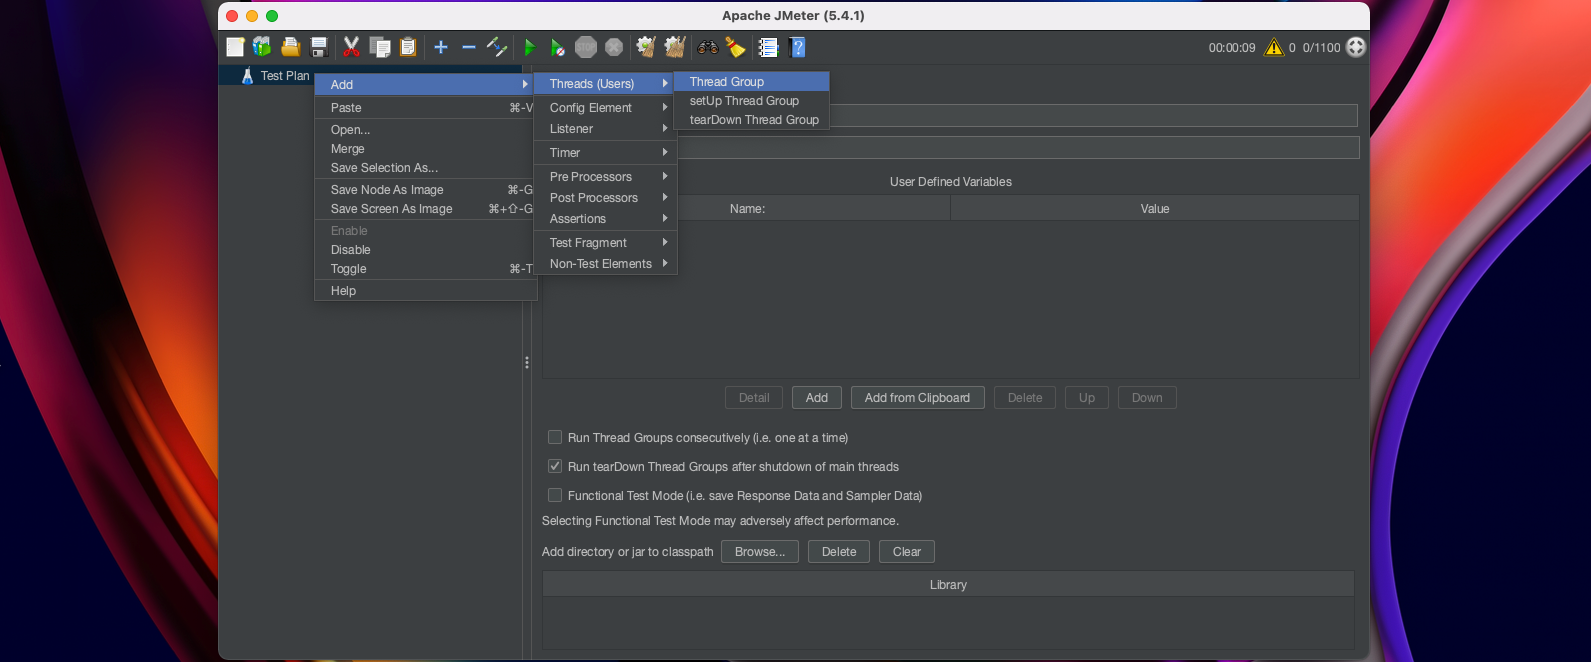
We can set in Thread Group the Number of Threads (users) – in this case, it will be 200, and the Ramp-up period (seconds), where we can set how long threads will be processed – in this case, 180. We can Specify Thread Lifetime but we won’t do that in this case.

Samplers hold the actual Work of JMeter i.e., by sending requests to the server and waiting for the responses.
We will tell us something about some of them.
FTP Request lets us send an FTP “download file” or “upload file” request to an FTP server.
HTTP Request lets us send an HTTP/HTTPS request to a web server (can also be used for SOAP or REST Webservice).
JDBC Request lets us execute Database Performance Testing. It sends a JDBC Request to a database.

We’ve added the HTTP Request and entered the data from specification.
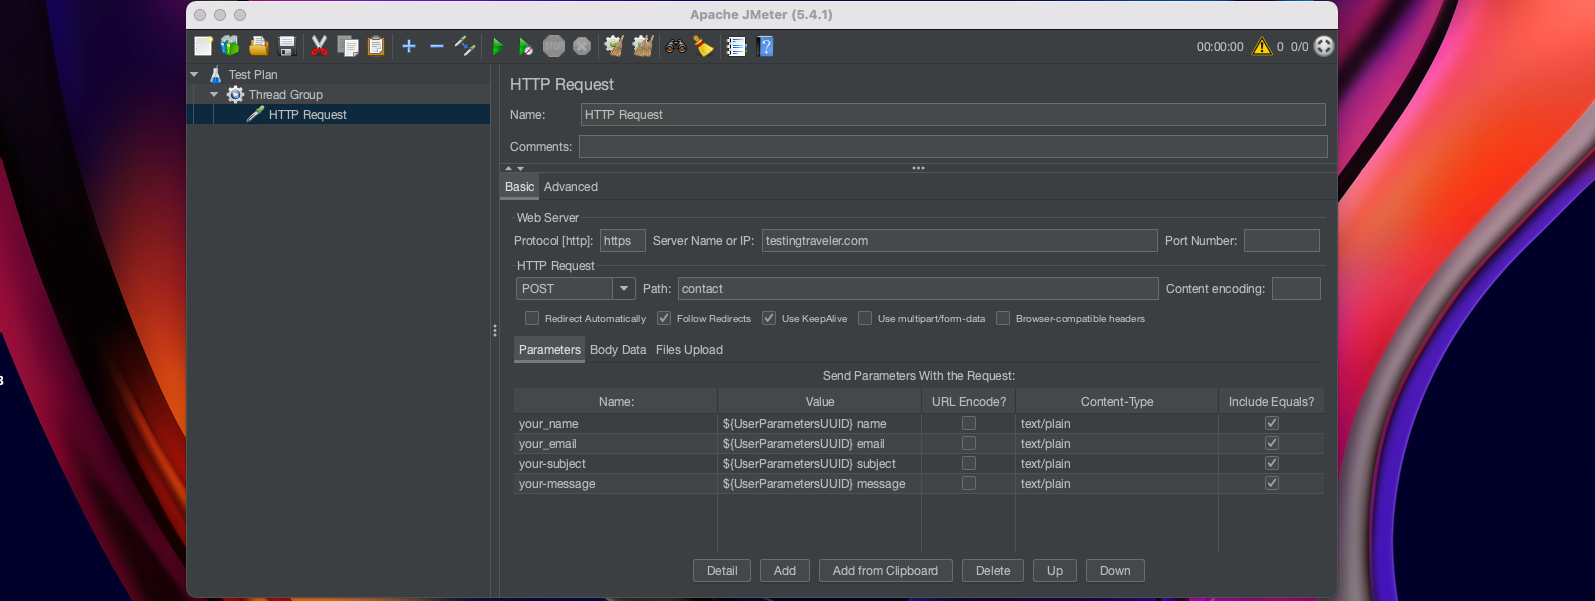
Pre-processor is used to take actions before any of the Sampler Requests sent to the server, like modifying settings of a Sample Request before it runs, or updating variables.
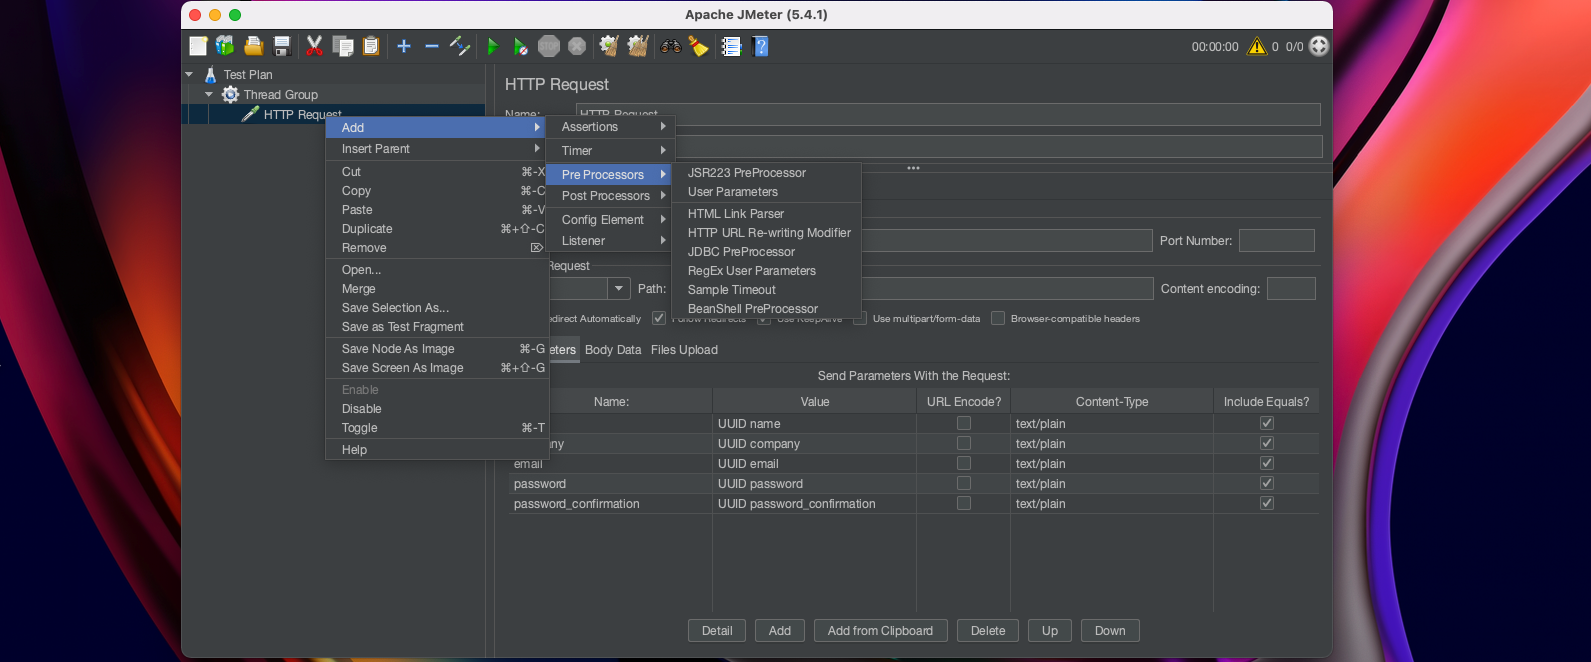
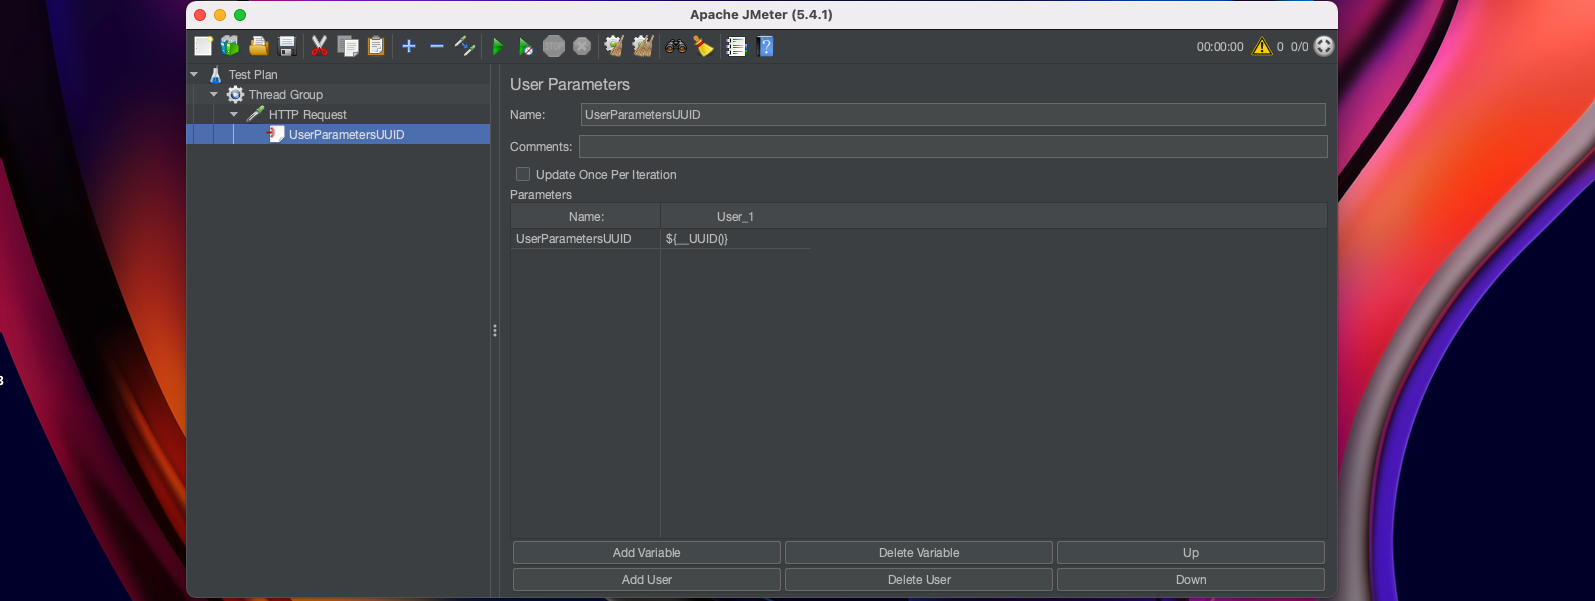
In this case we’ve used the User Parameters to add the UUID which lets us to generate the unique value. So, we will name our Variable UserParametersUUID and enter the value ${__UUID()}. Once we’ve done it, we can enter the variable in HTTP Request Parameters (as in the above screenshot).
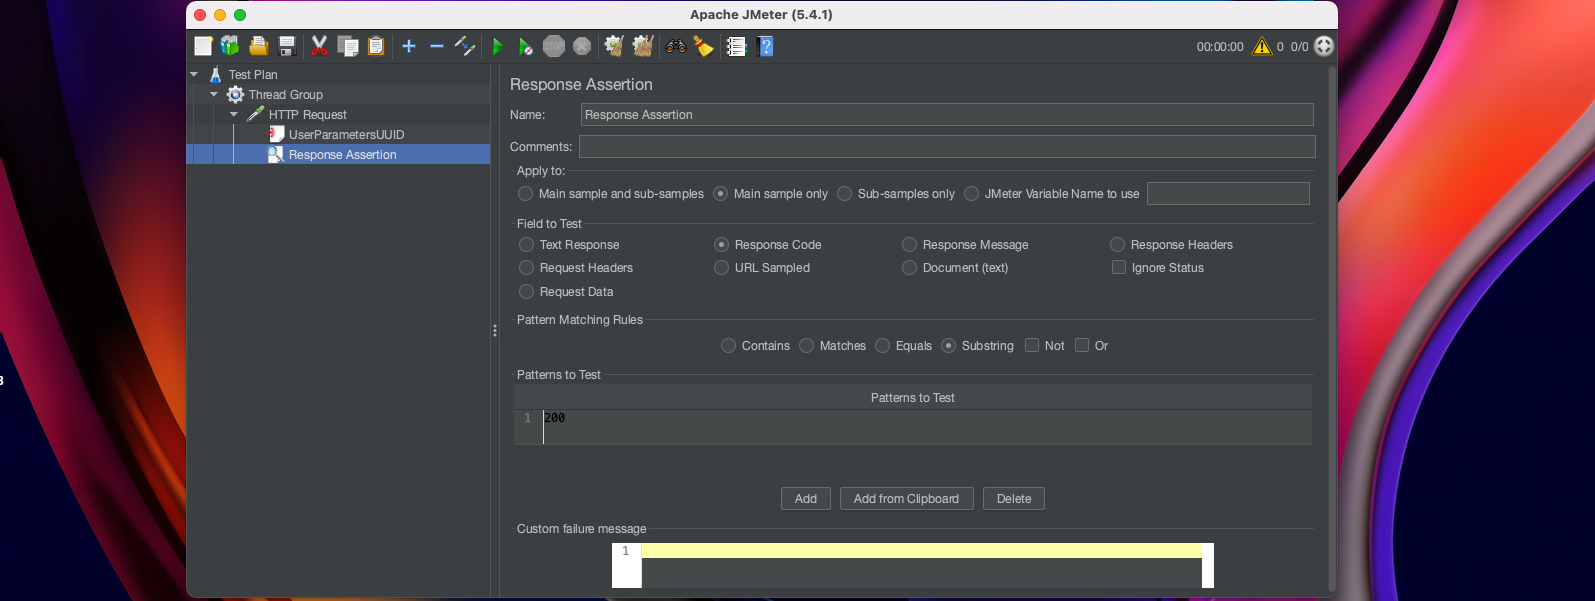
Assertions help to add up checks on the responses received from the Samplers. Using this, we can ensure that the application is returning up the responses as expected.

In this case we’ve added the Response Assertion to validate if the page will response code = 200.
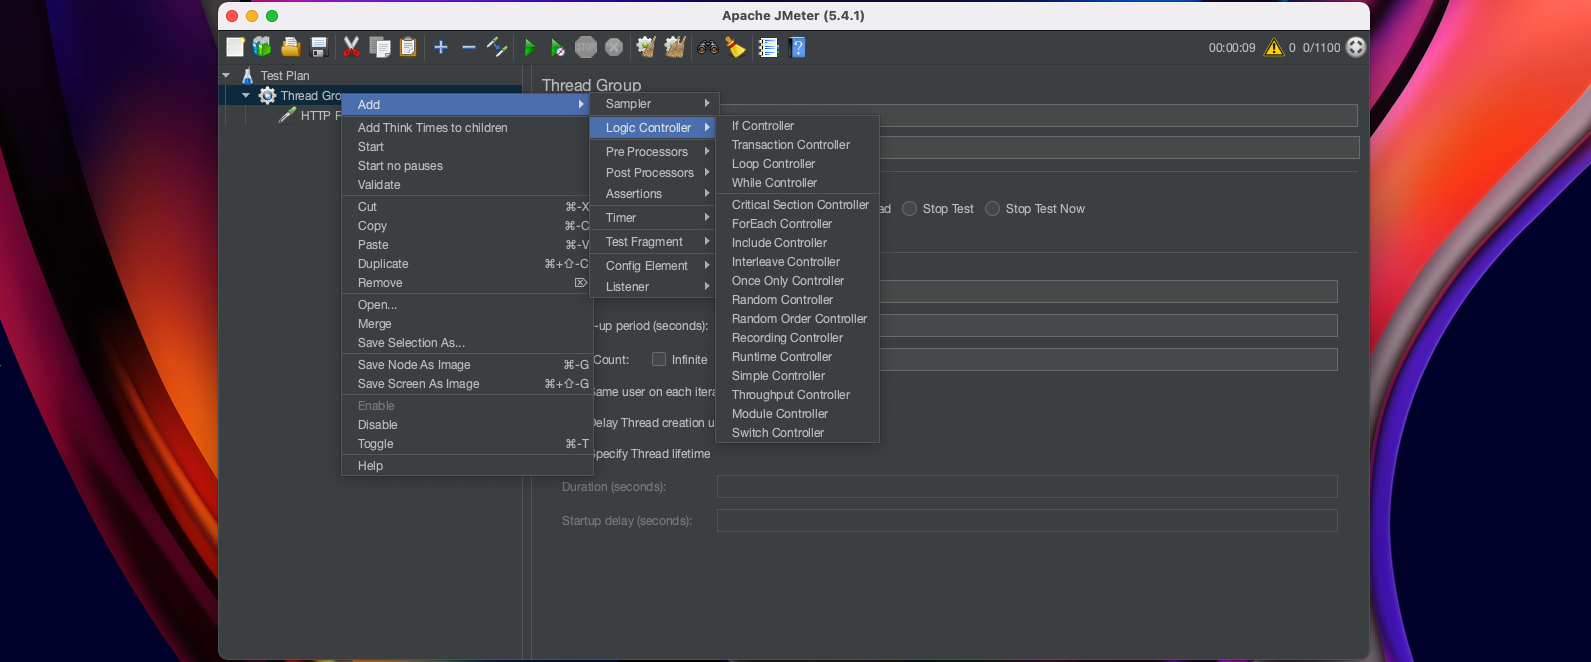
We have also (we won’t use it in our example):
Logic Controllers, which determines which order in which samplers would actually process.
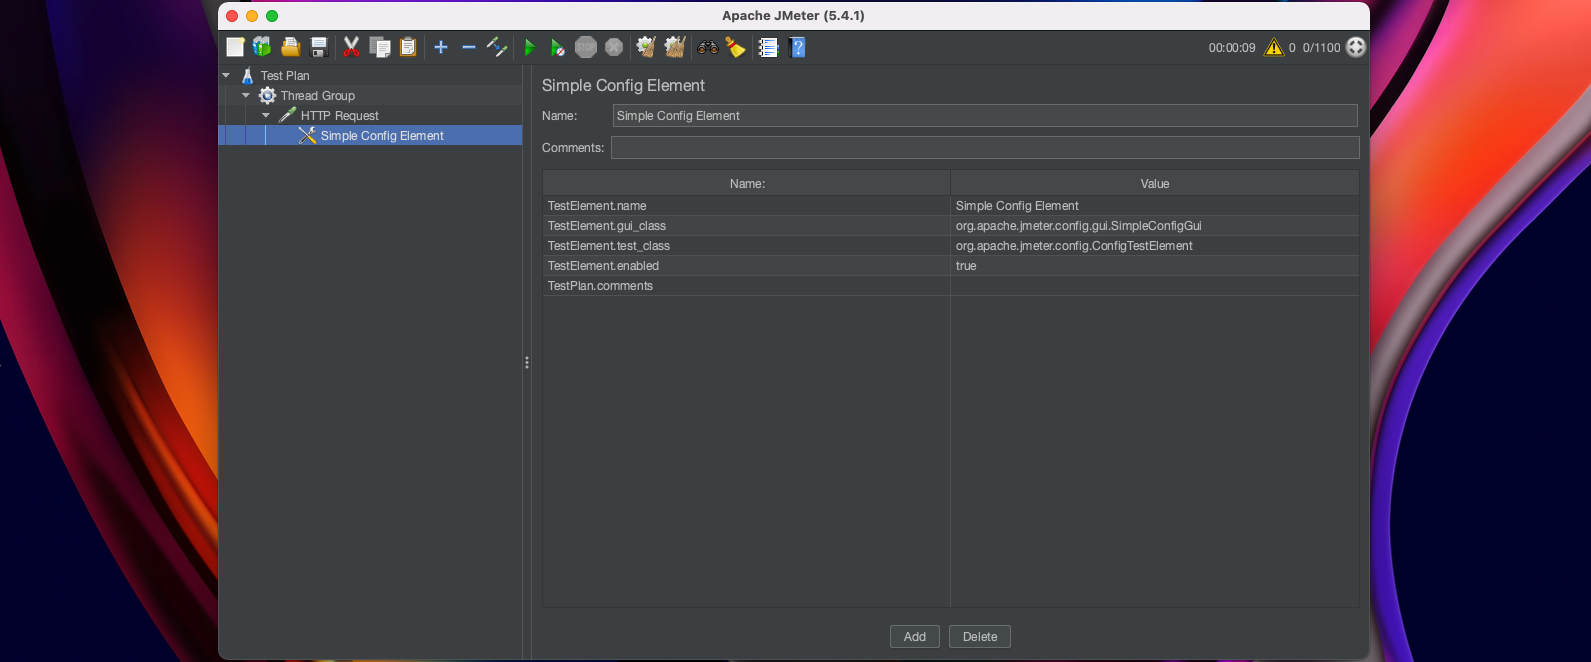
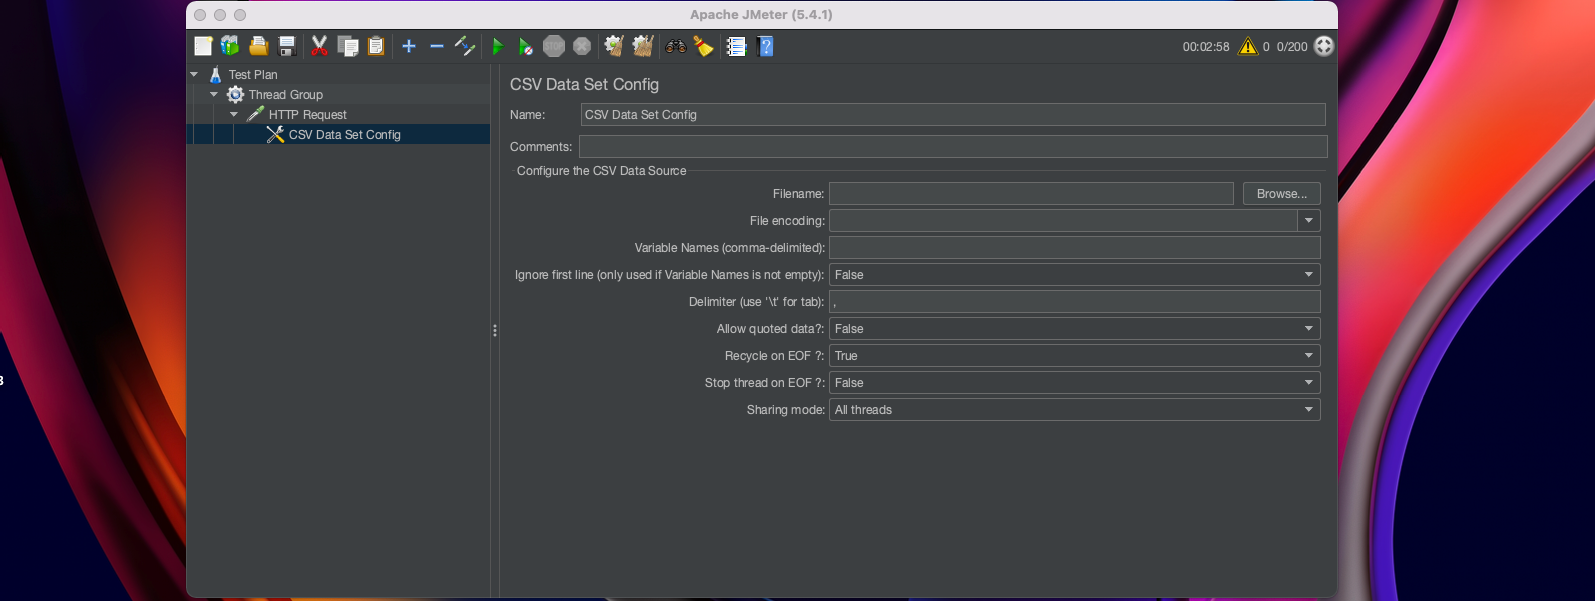
Configuration is used to add up variables used in the Samplers. Though it doesn’t send any requests it can modify the requests.
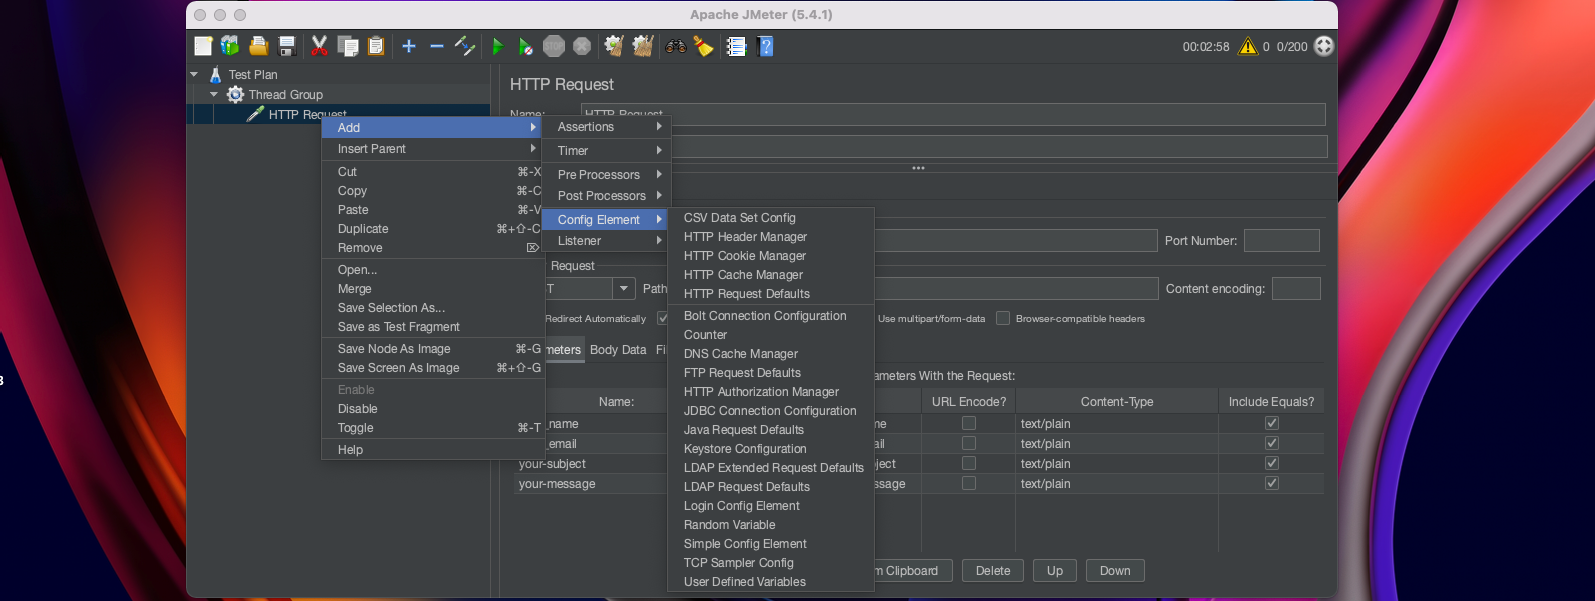
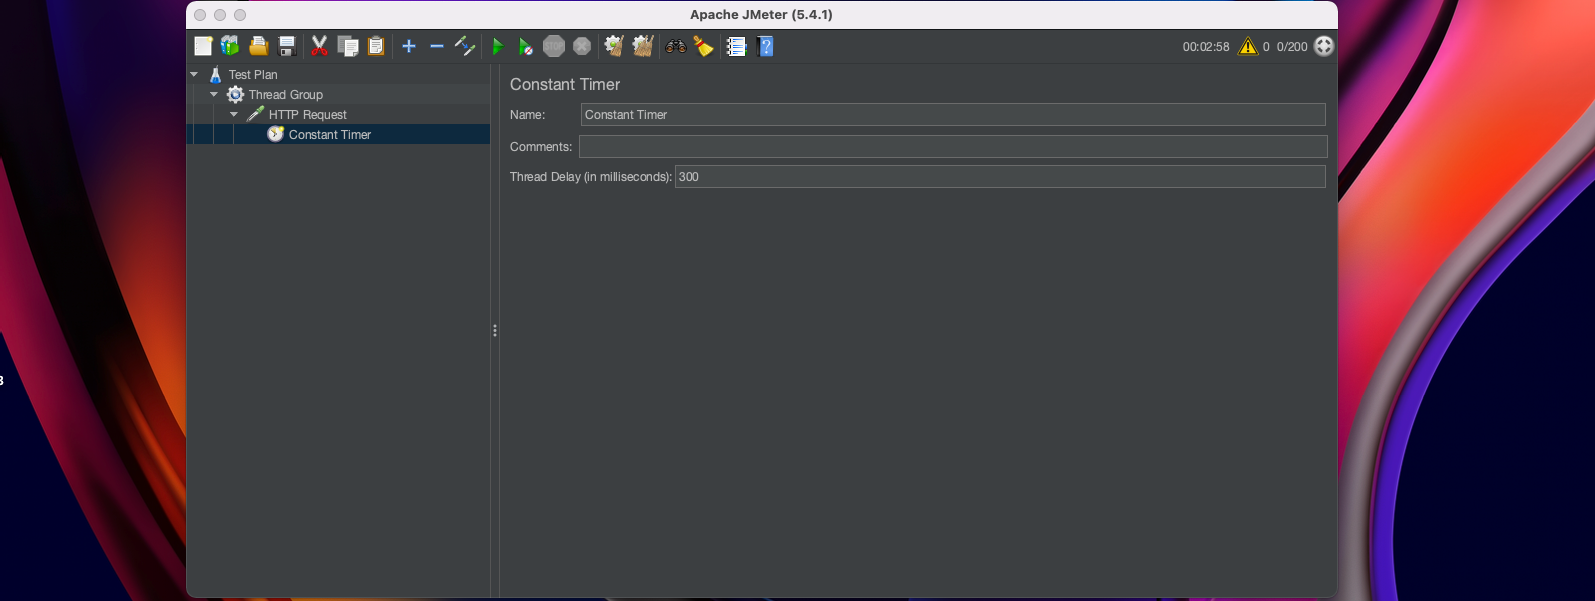
Timers are used to have user-defined timers between the Requests sent. By default, JMeter executes all the samplers in a Test Case in order without any pause. The timer will pause JMeter to delay for a certain amount of time before each of the samplers.

Post-processor is used to take actions after the Sampler Request has sent to the server, like extracting data from the response received.
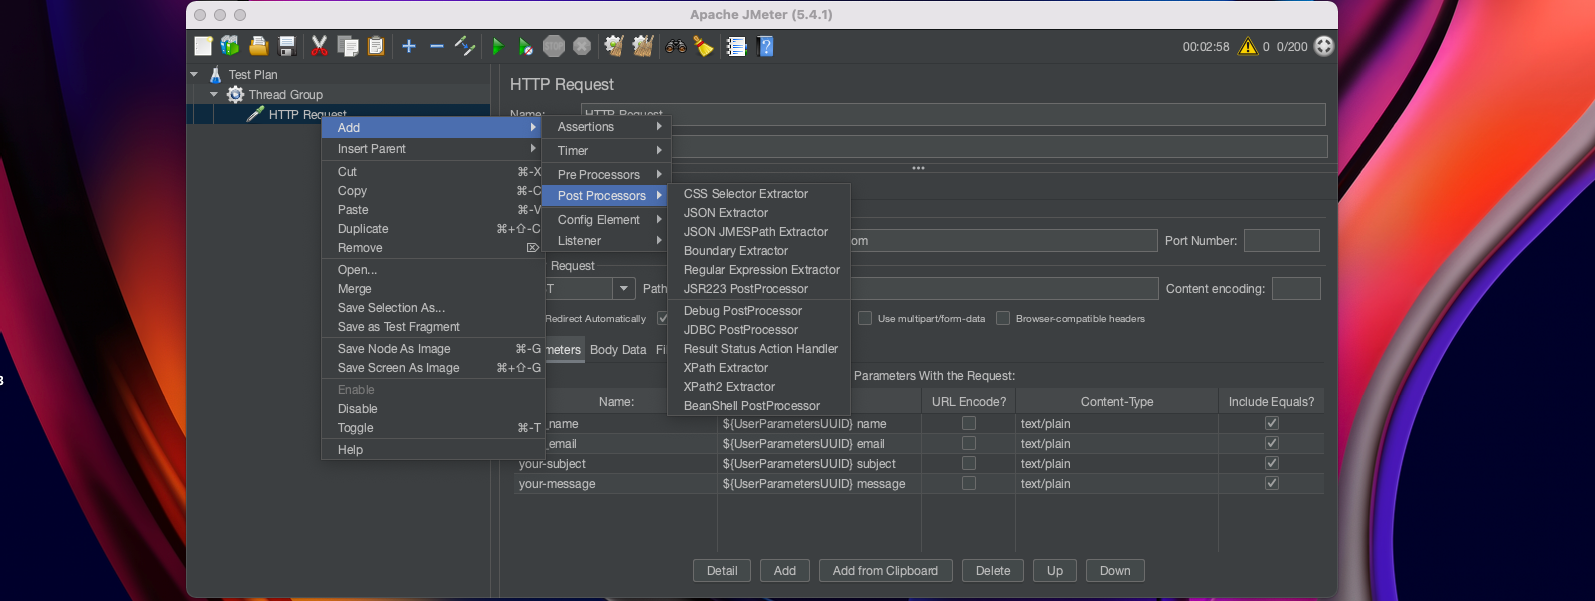
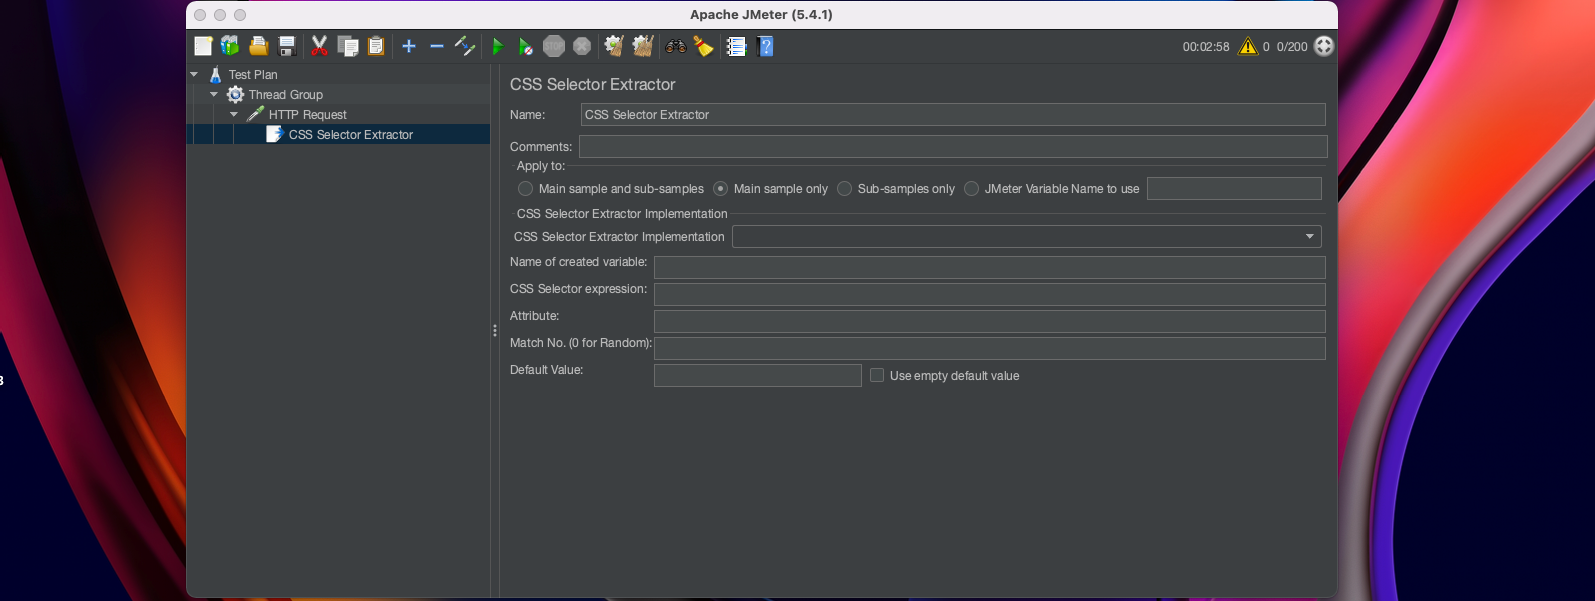
And now we will go to the Listeners, which help to gather information about the Test Cases while JMeter runs. All the listeners have the same data but, the only difference in them is the way the data is presented up on the screen.
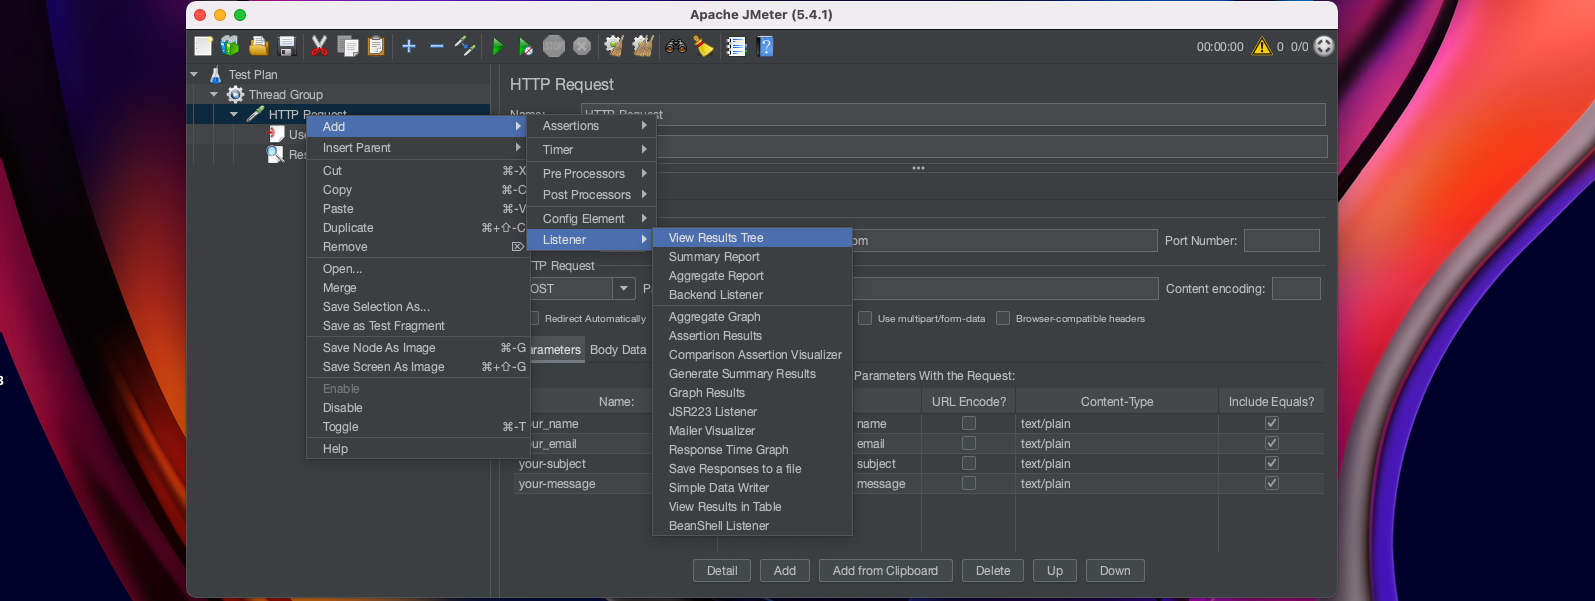
In this case we’ve used use the Results Tree to show the results.
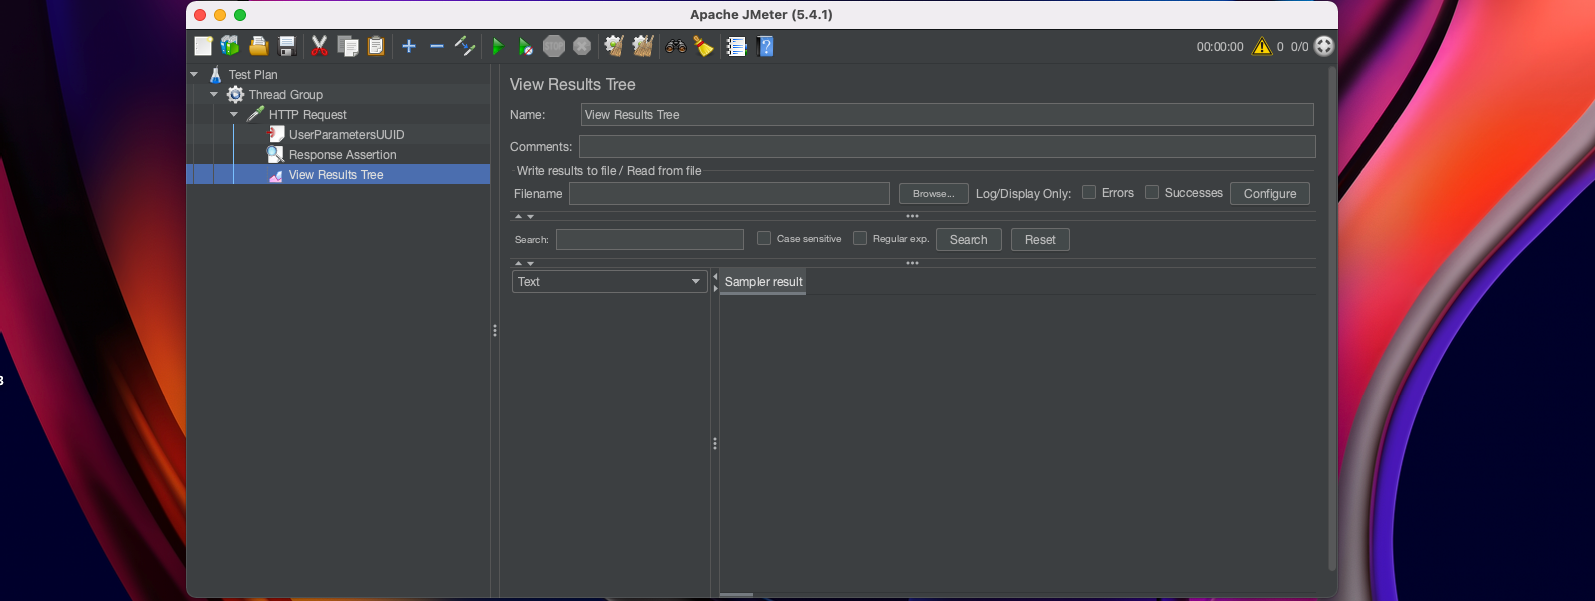

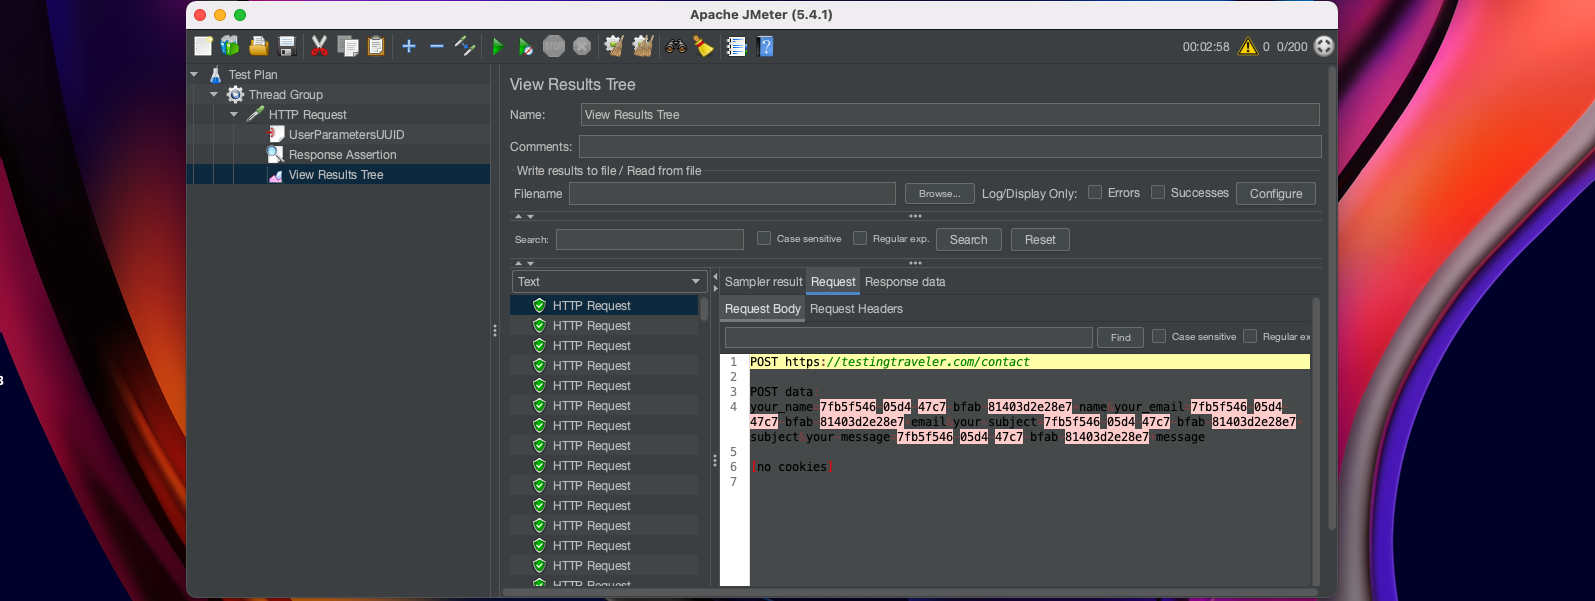
As we can see, all tests have been passed, which means that the 200 users could use the contact form and send the message via the contact page within 3 minutes.
Now we know what is JMeter and what can we do with JMeter. Moreover, we got knowledge about JMeter features. We’ve installed JMeter and explained the JMeter components by doing the example.
I hope you’ve enjoyed the article and found some inspirational information.
The next post will arrive soon 🙂


