In my last post, we’ve explained to ourselves the basic aspects of Performance Testing such as what is Performance Testing, and what it includes.
In this post, we will focus on metrics in performance testing. For instance, we will explain why we need performance metrics, how to select them, and categories of measurements.
Why do we need performance metrics?
To define the goals of performance testing and evaluate the results of performance testing, we need to derive precise measurements and metrics from those measurements. We shouldn’t undertake these tests without understanding which measurements and metrics we need. If we ignore this advice, the following project risks may apply.
For example, we don’t know if the levels of performance are acceptable to meet operational objectives. Moreover, we didn’t define performance requirements in measurable terms. In addition, we wouldn’t have the possibility to identify trends that may predict lower levels of performance, and trends that may predict lower levels of performance. In addition, we cannot evaluate the actual results of a performance by comparing them to a baseline set of performance measures that define acceptable and/or unacceptable performance. Furthermore, we evaluate performance test results based on the subjective opinion of one or more people. As a result, the results provided by a performance test tool could be not understood.
Collecting performance measurements and metrics
As with any form of measurement, we can obtain and express metrics in precise ways. Therefore, we can and should define any of the metrics and measurements as meaningful in a particular context. This is a matter of how we perform initial tests and learning which metrics we need to further refine and which we need to add.
For instance, the metric of response time likely will be in any set of performance metrics. However, to be meaningful and actionable, we will need to further define the response time metric in different terms. For instance, the time of day, the number of concurrent users, the amount of data being processed, and so forth.
We can collect the metrics in a specific performance test that will vary based on the following context. For instance, in the business context (business processes, customer and user behavior, and stakeholder expectations), on operational context (technology and how we use it), and test objectives.
For example, we will choose the metrics for the performance testing of an international e-commerce website. They will differ from those which we choose for the performance testing of an embedded system used to control medical device functionality.
We need to consider the technical environment, business environment, or operational environment in which the assessment of performance we need. This is a common way how we categorize performance measurements and metrics.
We will present ourselves the categories of measurements and metrics which we can obtain from performance testing below.
Technical Environment
Performance metrics will vary by the type of technical environment. It can be web-based, mobile, internet-of-Things (IoT), or desktop client devices. Moreover, it can be also server-side processing, mainframe, or databases. In addition, it may be the networks, or also the nature of software running in the environment (e.g., embedded).
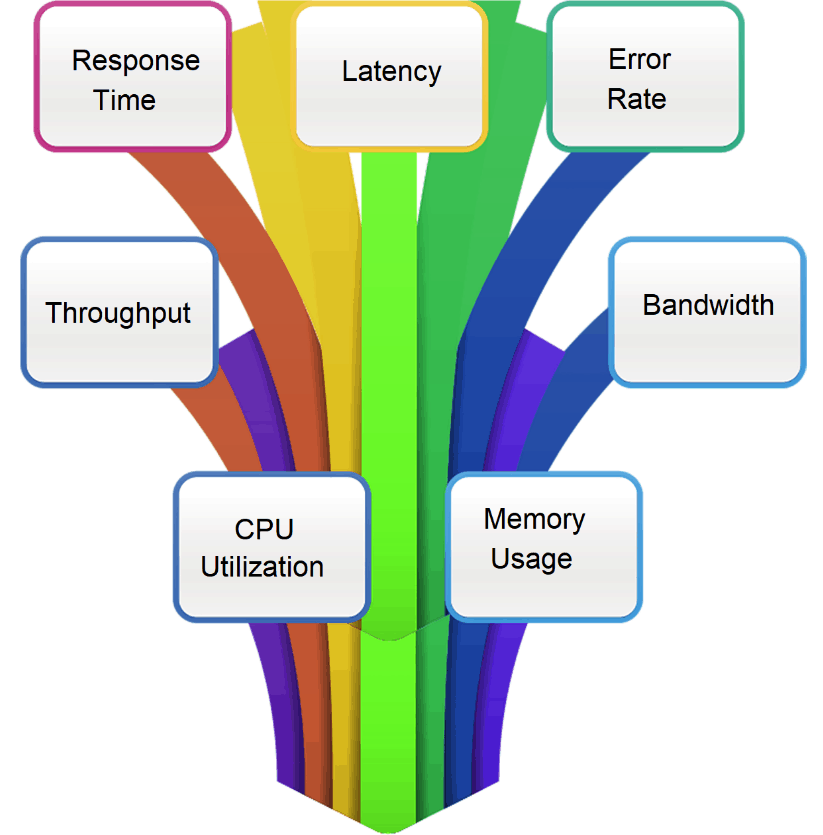
The metrics include the response time (e.g., per transaction, per concurrent user, page load times). They include also resource utilization (e.g., CPU, memory, network bandwidth, network latency, available disk space, etc.). We can also find the throughput rate of the key transaction (i.e., the number of transactions that we can process in a given period of time) in them. They also include the batch processing time (e.g., wait times, throughput times, database response times, completion times). The metrics contain also numbers of errors impacting performance, and completion time (e.g., for creating, reading, updating, and deleting data). They also contain background load on shared resources (especially in virtualized environments), and software metrics (e.g., code complexity).
Business Environment
From the business or functional perspective, performance metrics may include business process efficiency (e.g., the speed of performing an overall business process, etc.). They may include also the throughput of data, transactions, or other units of work performed (e.g., orders processed per hour). We may find in them service Level Agreement (SLA) compliance or violation rates (e.g., SLA violations per unit of time), or scope of usage (e.g., percentage of users conducting tasks at a given time). The metrics can contain concurrency of usage (e.g., the number of users concurrently performing a task), or also the timing of usage (e.g., the number of orders processed during peak load times).
Operational Environment
The operational aspect of performance testing focuses on tasks that we don’t generally consider to be user-facing in nature. These include operational processes (e.g., the time required for environment start-up, backups, shutdown, and resumption times). We can find in them system restoration (e.g., the time required to restore data from a backup). These may contain also alerts and warnings (e.g., the time needed for the system to issue an alert or warning).
Selecting performance metrics
We should note that collecting more metrics than required is not necessarily a good thing. Each metric that we’ve chosen requires a means for consistent collection and reporting. It is important to define an obtainable set of metrics that support the performance test objectives.
For example, the Goal-Question-Metric (GQM) approach is a helpful way to align metrics with performance goals. The idea is to first establish the goals, then ask questions to know when the goals have been achieved. Metrics are associated with each question to ensure the answer to the question is measurable. We ought to note that the GQM approach doesn’t always fit the performance testing process. For example, some metrics represent a system’s health and are not directly linked to goals.
We need to realize that after the definition and capture of initial measurements we will need further measurements and metrics to understand true performance levels and to determine where we will need corrective actions.
How to aggregate results from Performance Testing?
The purpose of aggregating performance metrics is that we can understand and express them in a way that accurately conveys the total picture of system performance. When we view performance metrics at only the detailed level, drawing the right conclusion may be difficult—especially for business stakeholders.
The purpose of aggregating performance metrics is that we can understand and express them in a way that accurately conveys the total picture of system performance. When we view performance metrics at only the detailed level, drawing the right conclusion may be difficult—especially for business stakeholders.
For many stakeholders, the main concern is that the response time of a system, website, or other test object is within acceptable limits.
Once we’ve understood the performance metrics that have we achieved, we may aggregate the metrics. So that business and project stakeholders can see the “big picture” status of system performance. We can aggregate them so that we can identify performance trends, or we can understandably report performance metrics.
Key sources of performance metrics
System performance should be no more than minimally impacted by the metrics collection effort (known as the “probe effect”). In addition, the volume, accuracy, and speed with which performance metrics we must collect make tool usage a requirement. While the combined use of tools is not uncommon, it can introduce redundancy in the usage of test tools and other problems.
We have three key sources of performance metrics, which we will present below.
Performance Test Tools
All performance test tools provide measurements and metrics as the result of a test. Tools may vary in the number of metrics shown, how the metrics are shown, and the ability for the user to customize the metrics to a particular situation.
Some tools collect and display performance metrics in text format, while more robust tools collect and display performance metrics graphically in a dashboard format. Many tools offer the ability to export metrics to facilitate test evaluation and reporting.
Performance Monitoring Tools
We often employ performance monitoring tools to supplement the reporting capabilities of performance test tools. In addition, we may use monitoring tools to monitor system performance on an ongoing basis and to alert system administrators to lowered levels of performance and higher levels of system errors and alerts. These tools may also be used to detect and notify in the event of suspicious behavior (such as denial of service attacks and distributed denial of service attacks).
Log Analysis Tools
Some tools scan server logs and compile metrics from them. Some of these tools can create charts to provide a graphical view of the data.
We may record Errors, alerts, and warnings in server logs. They include high resource usages, such as high CPU utilization, high levels of disk storage consumed, and insufficient bandwidth. We can find in them memory errors and warnings, such as memory exhaustion, or deadlocks, and multi-threading problems, especially when performing database operations. They may contain database errors, such as SQL exceptions and SQL timeouts.
Typical results of a performance Test
In functional testing, particularly when we verify specified functional requirements or functional elements of user stories, we may define the expected results usually clearly and interpret the test results to determine if the test passed or failed. For example, a monthly sales report shows either a correct or an incorrect total.
Whereas tests that verify functional suitability often benefit from well-defined test oracles, performance testing often lacks this source of information. Not only are the stakeholders notoriously bad at articulating performance requirements, but many business analysts and product owners are also bad at eliciting such requirements. Testers often receive limited guidance to define the expected test results.
When we evaluate performance test results, it is important to look at the results closely. Initial raw results can be misleading with performance failures being hidden beneath apparently good overall results. For example, resource utilization may be well under 75% for all key potential bottleneck resources, but the throughput or response time of key transactions or use cases is an order of magnitude too slow.
Summary
In this article, we could get the answer to the following questions.
Why do we need performance metrics? How to collect performance measurements and metrics? In what way to select performance metrics? How to aggregate results from Performance Testing? What are the key sources of performance metrics?
We’ve got also the information about the typical results of a performance test.
If you’d like to find more details about performance measurements and metrics, take a look at the book “The Art of Application Performance Testing: From Strategy to Tools” by Ian Molyneaux, where he explained more details about them.
I hope you’ve enjoyed the article and found some interesting information.
The next post will arrive soon 🙂
The information in this post has been based on the ISTQB Foundation Level Performance Testing Syllabus.
Graphics with hyperlinks used in this post have a different source, the full URL included in hyperlinks.




[[Pingback]]
This article is curated as a part of #20th issue of software Testing Notes.
https://softwaretestingnotes.substack.com/p/issue-20-software-testing-notes